Launching Dec 6–12, 2027
This launch is approved and scheduled. The page and its dofollow backlink are live now - it joins the weekly drop in its launch week.
Kure Monitor
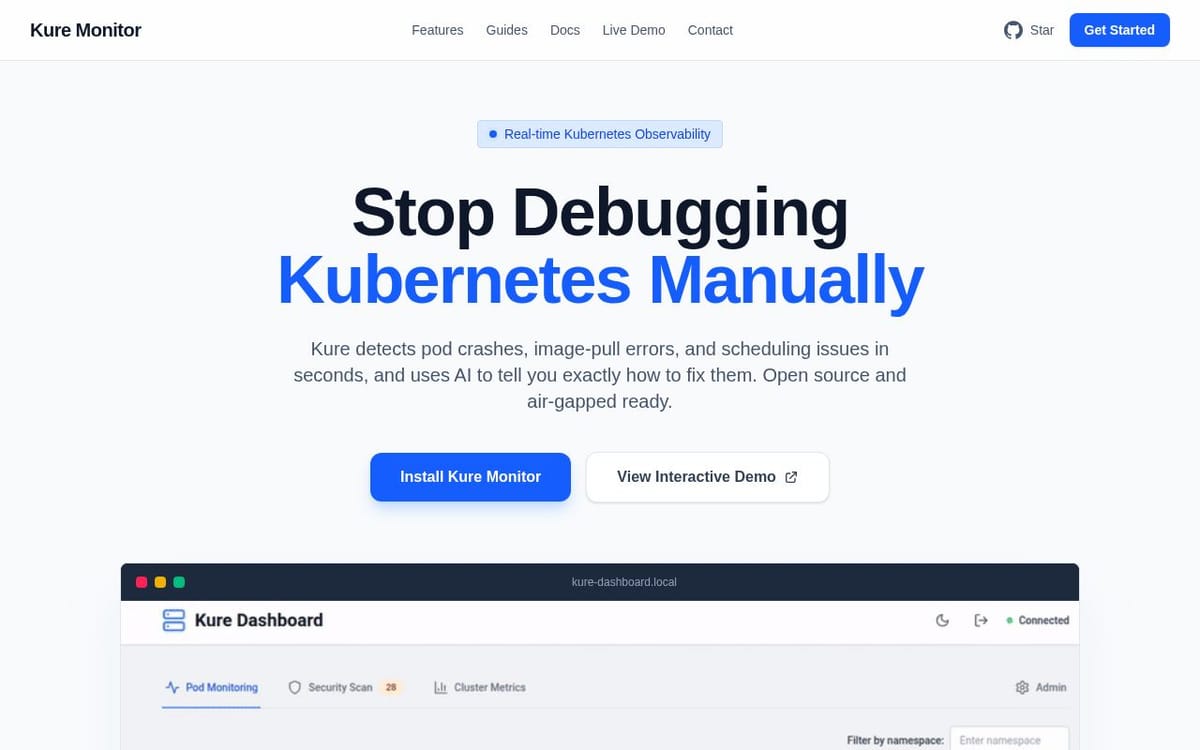
Kure detects pod crashes, image-pull errors, and scheduling issues in seconds, and uses AI to tell
50points
Recent Supporters
Details
Launched
November 2, 2026
Category
Developer Tools
Tags
About Kure Monitor
Kure Monitor is a Kubernetes observability and security platform for teams that need to diagnose cluster failures. It detects failing pods and provides AI-generated explanations and fixes using local or cloud LLMs. Features include live pod monitoring and logs, security checks for more than 50 misconfigurations, and a cluster topology graph.
Teams can configure multiple AI providers, add custom instructions in Markdown, and manage access with granular RBAC or Keycloak SSO. Kure installs with Helm, stores nothing outside the cluster, and is described as open source and air-gapped ready. It focuses on failure diagnosis and security, complementing rather than replacing Prometheus and Grafana.
What Kure Monitor does
Kure is a Kubernetes observability platform focused on failure diagnosis and security. It detects pod crashes, image-pull errors, and scheduling issues, then uses AI to provide context-aware explanations and fixes. It also audits clusters for security misconfigurations and provides live pod monitoring, logs, and topology features. Kure is intended to complement Prometheus and Grafana rather than replace them; the page says it does not provide time-series metrics or alerting rules.
Users install Kure in a Kubernetes cluster with Helm. It monitors pods and detects failures, then provides AI explanations and copy-paste fixes using local or cloud language models. Users can register multiple AI providers, set a primary provider with automatic failover, or select a model during pod triage. Markdown instructions can provide models with cluster topology and team standards. The platform also streams container logs, scans for security issues, and supports Slack or Teams failure notifications.
Kure is for teams operating Kubernetes clusters that need help diagnosing pod failures and checking cluster security. The page highlights team access controls, namespace-based permissions, and Keycloak SSO, along with support for local language models and air-gapped environments. It is positioned as a complement to Prometheus and Grafana, with a focus on failure diagnosis and security rather than metrics, alerting, or log aggregation.
Based on kuremonitor.com, read on Nov 2, 2026.
Key features
- AI diagnosis of pod failures
- Security scanning for cluster misconfigurations
- Live pod monitoring and container logs
- Multiple AI provider profiles with failover
- Team access controls and Keycloak SSO
- Custom Markdown instructions for AI models
What people use Kure Monitor for
- 01Diagnose pod crashes, image-pull errors, and scheduling issues
- 02Audit clusters for security misconfigurations
- 03Inspect live pods and stream container logs
- 04Configure team permissions by namespace and dashboard tab
- 05Send Slack or Teams notifications about failures
More in Developer Tools
Browse all Developer Tools Fotools Online Tools
Fotools offers over 200 free online tools for developers and everyday users
 Streamnode
Build HTTP endpoints visually without writing code
 Clonesite AI
https://clonesite.ai
 Host a site with no account, in seconds
Instant file hosting and static website publishing without an account.
 Actionbox
Human Approval for your AI Agents, Software and Scripts
 Benzi
Compiler backed agent - 78.2% on SWE-bench Verified for < 10¢